General information on forms
The primary way in which you can access the data in the NetSim databas is via a grid form in which the data for an object is displayed in columns. Pipes are displayed by way of example here. The grid shows all pipes in the model. When you select a pipe in the map screen, this pipe is highlighted in the grid, and the highlighted pipe in the grid is also highlighted in the map screen.
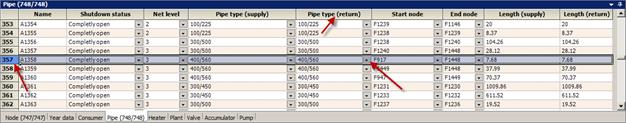
The fields which provide primary information on the pipe are displayed in the grids. Start and end node, pipe type, etc. All data on a pipe can be accessed in a detailed form. The detailed form is opened if you double-click in the column at the far left. The values listed from another table, e.g. pipe type, are selected from drop-down lists. Double-clicking in the column header sorts the form according to the highlighted column.
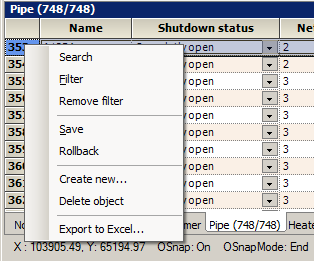 There are more options in the right-click menu.
Search and filter, Save or undo (non-saved) changes. Create new objects and
delete objects, and export to Excel.
There are more options in the right-click menu.
Search and filter, Save or undo (non-saved) changes. Create new objects and
delete objects, and export to Excel.
Amended fields are shown with a different colour until you have saved or undone your change.
You can generally select a number of fields in a column and paste a value into the highlighted fields.
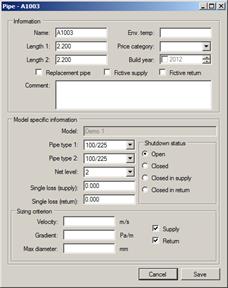
Detailed form for pipe. You can access all data applicable to the pipe here!
If you select a value from a drop-down list, you can restore the field to an empty field by selecting the empty value in the list.