Charts
The tab Charts shows, in diagram form, a selected calculation value along the route through the network which you created in the map. You configure the diagram using the tools in the chart tools panel and in the right-click menu.
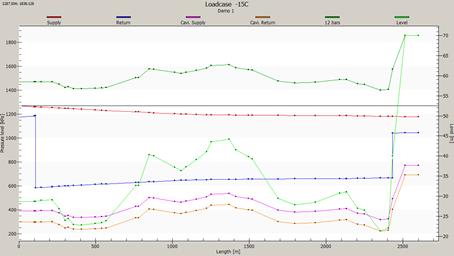
Plot settings
Select which calculation value is to be displayed in the diagram. You can choose from pressure and pressure level in the units kPa, mvp and bar, Pressure gradient in the units Pa/m and bar/km and temperature °C. If cavitation pressure is selected, the limit for cavitation in the supply pipe and return pipe is displayed. Select Show level if you want to [go via the nodes elevation.
Construction curve 1
Enter a name and value and select whether the temperature in a supply pipe or a return pipe is to form the basis of density calculation, and there is a pressure value which you enter. This curve can, for example, show where there is 16 bar of pressure along the route in a plot of pressure level. Select/deselect Show to enable/disable this curve.
Construction curve 2
The same function as Construction curve 1.
Zoom function
You can enlarge a section of the diagram. Hold down the cursor and drag it to the side. Restore the diagram by selecting Undo zoom in the right-click menu.
Select data point
Click on a point in the diagram to display the coordinates for the point in the diagram in the upper right-hand corner. The node name and curve values are displayed in the bottom left-hand corner. You can use the left/right arrow keys to move along a curve, and use the up/down arrow keys to toggle between curves.
Right-click menu
You can use the right-click menu to save the diagram to a file/cutout in a range of formats/printers. Check the scaling of the diagram axes, enable/disable grids in the diagram and adapt colours and styles for the curves.
The bottom right-hand corner of the diagram shows the time step from which the results are displayed. The total number of time steps included in the calculation. If the calculation includes more than one time step, you can select time steps using < >.