Pipe table
Pipe table displays all calculation results for the pipes in a grid.
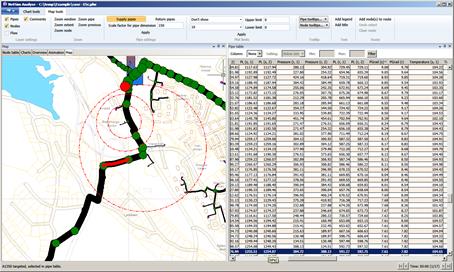 You can filter and sort in
the grid and copy data from there to Excel.
You can filter and sort in
the grid and copy data from there to Excel.
The bottom right-hand corner shows the time step from which the results are displayed. The total number of time steps included in the calculation. If the calculation includes more than one time step, you can select time steps using < >.
The table tabs are sorted by double-clicking the table column headers.
The filter function can be used to filter the selected column in the table.
In the right-click menu, you can opt to view a pipe in the map, select Show on map. Make sure that you have clicked on Map to load it beforehand. You can select several pipes in the table by holding down Ctrl or Shift.
The right-click menu also includes a search command which searches on pipe name. You can select single or multiple rows by pressing Shift/Ctrl and use the clipboard to copy to text or an Excel file by pressing Ctrl+C / Ctrl+V.
You can move the columns so that the sorting suits your needs. Take hold of a column and drag it to the right or left to move it.