Aiolos Quality Service can be used to make evaluations of forecast quality as a background process. Actually, everything that you normally do in the Follow Up tab in a manual manner you can set to run automatically using Aiolos Quality Service. This will save you time and also alert you so you can work proactively in case of changes in forecast quality.
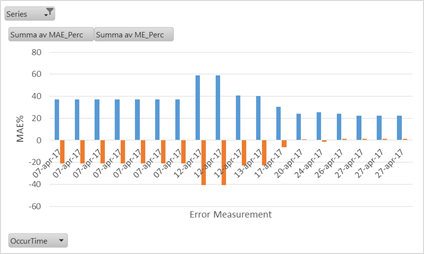
In the figure below, we have an example where the output from automatic quality checks has been plotted in a diagram. The quality check was set to run once every few days and the evaluation covers the latest two weeks of forecast at each time of occurrence. In this plot, we can see that the mean error (orange) decreased over time, as did the mean absolute error (blue) for the later part of the diagram.
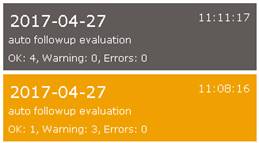
After running an evaluation on exported or unadjusted forecasts, the results can be compared to statistic limits set by the user. From these limits the forecast quality check gives a message for OK forecast or NOT OK forecast. This warning can be viewed in the Status tab and also be sent as an e-mail alert to a user.
The results from automatic follow up can be sent to Vitec using the WebConnect tool. This gives Vitec the ability to check the forecasts and keep an eye on the quality for your specific forecast series.
A status message for the forecast quality check can also be sent to an e-mail address. This feature can be used to warn the user or system administrator if the forecasts for the latest period has gone outside of the set limits for maximum allowed forecast error.
To get an overview of the results over time, the results can also be viewed directly in the status database for further analysis, see the example plot above. The table FollowUp in your database “StatusLogs.accdb” includes all previous runs of automatic follow up and is possible to view using Microsoft Access. The same table is also found in your tmp/follow up-folder in a simple .csv-file. The .csv-file can be opened as a text document or in excel for further analysis.