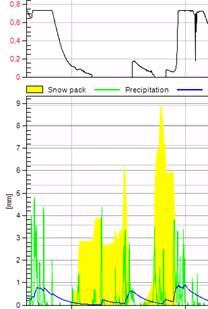
Figure 1 Example of how maximum storage and discharge rate can be set to give a smooth runoff curve.
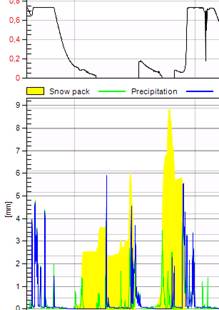
Figure 2. Example of runoff curve when maximum storage is low or discharge rate is high and thus resulting in spikes of runoff.
In “Max storage (mm)” you enter the average storage capacity of the catchment area in millimetres. When the ground is saturated all precipitation is assumed to go to production.
“Discharge rate” indicates how much of the currently stored volume of water escapes via direct runoff into the groundwater per hour and adds to the production.
The Achelous model allows you to delay and smooth the effects of precipitation and snow melt. A low value of discharge rate results in a smoothed out runoff profile. Working with the model parameters you should attempt to get the response to the impulse in the form of increased runoff to follow the response in production as far as possible in upturns and downturns.
Times when production is near maximum will be ignored in the regression as this can interfere with the linear regression relationship.
If “Max storage (mm)” is not equal to 0 the catchment area will be assumed to have a storage capacity. If the storage capacity is exceeded the ground is deemed saturated and all further precipitation will escape as runoff. A low value for storage capacity results in spikes on the “Runoff” curve. Figure 1 and Figure 2 shows examples of different settings of maximum storage and discharge rate. In Figure 1 the runoff curve is smooth after applying balanced values of maximum storage and discharge rate. Figure 2 the runoff curve has spikes that results either from a low maximum storage or a high discharge rate.
|
Figure 1 Example of how maximum storage and discharge rate can be set to give a smooth runoff curve. |
Figure 2. Example of runoff curve when maximum storage is low or discharge rate is high and thus resulting in spikes of runoff. |