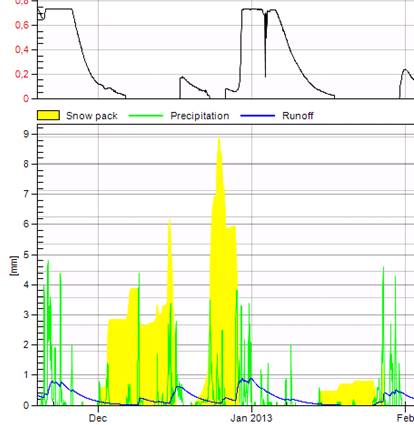
To investigate the possibility of using inflow (runoff) as a predictor for production, you can opt to look at the history for a longer period back in time. Figure 3 shows an example where the curve for production and runoff is comparable and thus inflow can be used as a predictor for production.
Figure 3. Production is displayed in the upper diagram. In the lower diagram the calculated snow depth (“Snow pack”) hour by hour in millimetres in melted form. The green bars are the total precipitation (as snow or rain) and the blue line indicates runoff from the area.