Before the forecast is produced, historical data should be checked as this is input data for the forecast model. Errors in the history may have an adverse effect on forecast quality.
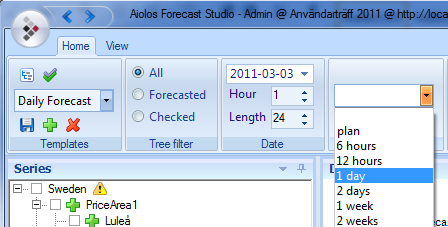
In the “History” drop-down menu, select the time period that is to be displayed in the diagram for the selected series. To import the history for several series at the same time, there is a control “Fetch history” that imports all the highlighted series together.
If a forecast has been produced, the diagram is split into two sections separating the forecast from the history via a vertical red line. On the left of the line is the history and on the right the forecast.
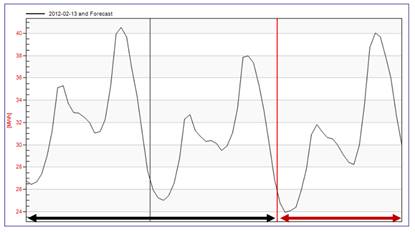
The black arrow shows the history, and the red arrow shows the forecast.