symbol means
that the whole value of every hour in an underlying series will be added to the
corresponding hour’s value in the overlying series.
symbol means
that the whole value of every hour in an underlying series will be added to the
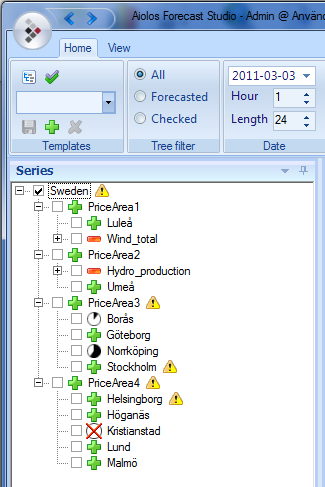
corresponding hour’s value in the overlying series.All load series configured in the configuration are shown in the tree structure in the window “Series”.
For aggregated series, the top node and underlying series are shown in the configured structure. If only the top node is shown for aggregated series, you can show underlying series by clicking on the + symbol to the left of the series.
If only the top node is marked, all underlying series will be forecast even if they are not checked. If you want to see an underlying forecast, just mark it in the file tree. It will then be shown in the diagram, and its values will be shown in the data grid.
The symbol means
that the whole value of every hour in an underlying series will be added to the
corresponding hour’s value in the overlying series.
The  symbol means
that the whole value of every hour in an underlying series will be subtracted
from the corresponding hour’s value in the overlying series.
symbol means
that the whole value of every hour in an underlying series will be subtracted
from the corresponding hour’s value in the overlying series.
The  symbol in
front of the series name shows that a part of each hour’s value will be added to
the overlying series. This is typically used for fractions, and the symbol also
shows the size of the fraction. If you hover the cursor over the symbol, a small
box will appear showing the percentage for the series.
symbol in
front of the series name shows that a part of each hour’s value will be added to
the overlying series. This is typically used for fractions, and the symbol also
shows the size of the fraction. If you hover the cursor over the symbol, a small
box will appear showing the percentage for the series.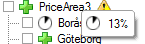
If there is no fraction for the forecast period, the  symbol will be shown.
When you have produced a forecast, you may encounter
warnings or errors. Warnings are indicated with the  symbol, and errors with the
  symbol. An error means that no forecast
has been created, while a warning means that a forecast has been created but
there may have been a problem during its calculation. The symbols will be shown
at top level and then all the way down in the file tree as far as the
series/aggregation that caused it. If you hover the cursor over the symbol, you
will see a message in a tooltip. If there are lots of messages, these will be
cut off after around ten messages. All messages can always be viewed in notepad
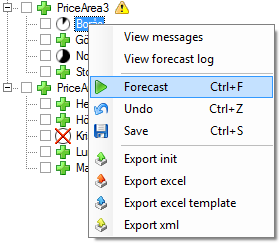
format by right-clicking on the series and selecting “View messages”. Here, you
can also view any log file from the forecast calculation.
symbol. An error means that no forecast
has been created, while a warning means that a forecast has been created but
there may have been a problem during its calculation. The symbols will be shown
at top level and then all the way down in the file tree as far as the
series/aggregation that caused it. If you hover the cursor over the symbol, you
will see a message in a tooltip. If there are lots of messages, these will be
cut off after around ten messages. All messages can always be viewed in notepad
format by right-clicking on the series and selecting “View messages”. Here, you
can also view any log file from the forecast calculation.
If you want to carry out a new load forecast for a series, you can mark the series for which you want to produce a new forecast and then right-click and select “Forecast” – see the image below.