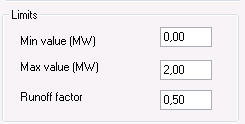
In addition, the inflow between the forecast period and the period after the sub-interval is compared. To provide a rough estimation of what inflow in mm equates to in production, the mean production during the training period is divided by the mean inflow. The impact of the inflow, ranging from 0 to 100% (0 to 1) is also set manually in the model setting below under “Runoff factor”. Where 0 % means that none of the runoff goes to production (inflow to production) and 100 % means that all runoff in the area adds to (inflow) production for the power plant.
The sub-intervals are ordered in terms of similarity of output/inflow pattern based on the total MAE, mean absolute error.
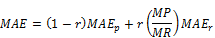
Where r is the “Runoff factor”, MAEp the mean absolute error for production, MP/MR mean production divided by mean inflow (which “translates” the inflow into production), and finally MAEr, which is the mean absolute error for inflow. For forecast periods with monotonically non-increasing inflow, sub-intervals are disabled if they are followed by periods where the largest absolute difference between two values corresponds to an increase in production.
For the interval that most resembles the pattern that precedes the forecast period, the mean value of the subsequent hours that are to correspond to the forecast period is calculated hour by hour. The number of intervals to be included is determined by the value in “No of Statistical component intervals” (see below). The result will be both the mean production hour by hour and the inflow hour by hour, to be used subsequently in the following steps.