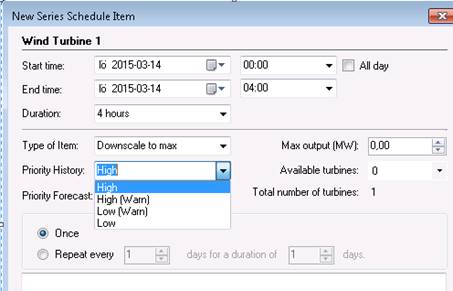
The two parallell ways of reporting stops and reduction in capacity; the series schedule and the imported time series data may come in conflict with each other. The settings that controls which of the ways should override the other are found in the series schedule item dialog and are called “Priority History” and “Priority Forecast”.
A schedule item can for both of these hold one of four possible values. For the types “Downscale to max” and “Bound to max” the following behaviour holds:
•High – The value specified in the schedule will override any values in the time series data.
•High (Warn) – The value specified in the schedule will override any values in the time series data, but if this occurs during the forecast process, the user will be alerted by a forecast warning.
•Low (Warn) – The value specified in the schedule will be overridden by the values in the time series data, if this occurs during the forecast process, the user will be alerted by a forecast warning.
•Low – The value specified in the schedule will be overridden by the values in the time series data.
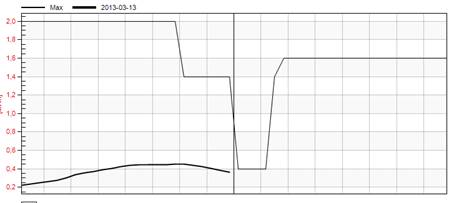
The difference between these two is that the settings for “Priority History” is valid when getting historical data for estimating the model and “Priority Forecast” determines the behaviour during the forecasted period. So, the effect on the max curve if we add the schedule item shown above with a total stop for the first 4 hours 2013-03-14 will look like the following, since the schedule item value will have a higher priority than the values in the file :
If we open the schedule once more, edit the schedule item
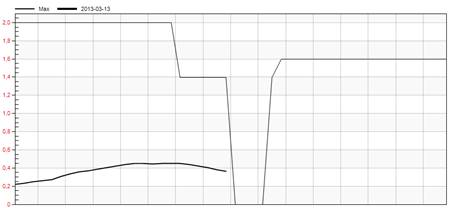
and set “Priority History” to low, and then update the graph by clicking on 
, then the dip will disappear since the values in the file will have predecence over the schedule item.
For a schedule item of the type “Down scale with reduction, the following holds depending on the “Priority type”:
•High – The value specified in the schedule will be subtracted from any values in the time series data.
•High (Warn) – The value specified in the schedule will be subtracted from any values in the time series data, but if there are any time series values not equal to the installed capacity and this occurs during the forecast process, the user will be alerted by a forecast warning.
•Low (Warn) – The value specified in the schedule will be ignored by the values in the time series data if there are any time series values not equal to the installed capacity and if this occurs during the forecast process if this occurs during the forecast process, the user will be alerted by a forecast warning.
•Low – The value specified in the schedule will be ignored by the values in the time series data if there are any time series values not equal to the installed capacity
So, if we for example change the type of our previous
schedule item to “Downscale with reduction” with a reduction of 1 MW and with a
high priority then the avalability curve will look like the curve below.