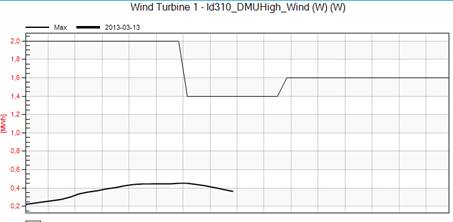
These aio8-files containing availability data can only be used together with the Zephyros model. The imported time series availability will be plotted in the graph as a “Max” curve and the corresponding numerical values presented in the grid to the right. And as seen in the figure below, the availability may continue forward in time as plans after the end of measured production values.