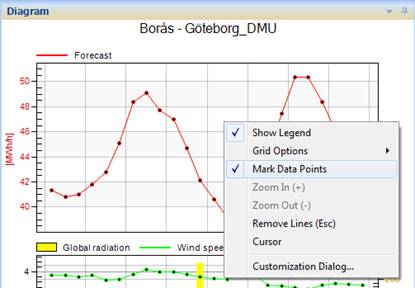
In order to be able to see each hour value more clearly in the diagram curve, the function for marking the hour values can be turned on by right-clicking with the mouse and selecting “Mark Data Points” from the list.