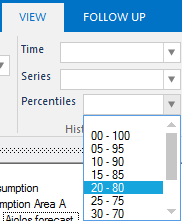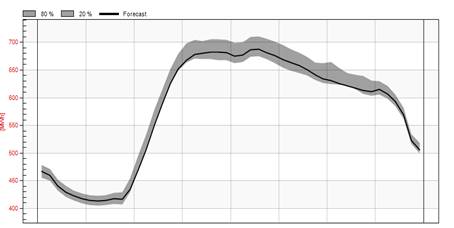
After making a forecast, the uncertainty of the forecast can be assessed by a high-low area graph representing a percentile range. In the View-tab, select the range desired from the available list of percentiles. The list contains pair of percentiles ranging from P0/P100 to P50 with a step of 5 percent. The shaded grey area darkens the closer to P50 you get. The percentiles must be calculated prior to the forecast by an automated followUp-action and are saved in files, one file for each series. If the program does not find a percentile-file corresponding to a specific series, both the upper and lower percentile-bounds will coincide with the forecasted values, thus the area will vanish completely.

