 above “Extracts”.
The follow-up can also be used to assess how incorrect
fractions affect the balance costs at the time of the forecast. To achieve this,
we will create a new extract template which we can call “Fractions”. Start again
by clicking on above “Extracts”.
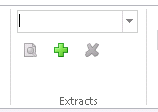
In the dialog box displayed, we again click on at the bottom left. When the dialog box is
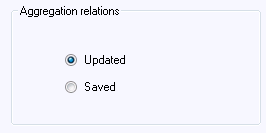
displayed, we define exactly the same settings as for “elspot” in the previous
section, with the difference that “Aggregation relations” is set for “Updated”
instead.
‘Aggregated relations’ control whether the program is to use the fractions that were available at the time of the export (“Saved”) or the fractions that were saved in the configuration database at the time of the evaluation (“Updated”) during aggregation for the forecast.
To assess how incorrect fractions affect forecast quality, therefore, we can compare
•forecasts with preliminary fractions against historical outcome with preliminary fractions.
•forecasts with preliminary fractions against historical outcome with final fractions.
•forecasts with final fractions against historical outcome with final fractions.
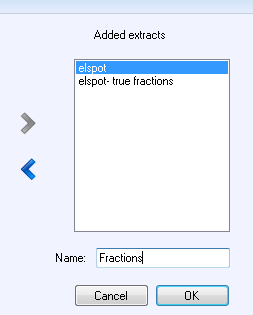
If we save the new extract setting by typing the name
“elspot – true fractions” and clicking on  , we can see that both elspot (the one we
created earlier) and the new one can be selected for a new selection. We will
select both and then type the name “Fractions” so that the right side of the
dialog box looks like this:
, we can see that both elspot (the one we
created earlier) and the new one can be selected for a new selection. We will
select both and then type the name “Fractions” so that the right side of the
dialog box looks like this:
Click on to select
whether you want to view both “Exported” and “Unadjusted” and start an new
evaluation by clicking on . 
Two “Exported” curves will now be displayed, one for “elspot” and one for “elspot – true fractions”, and the same for “Unadjusted” if this option has been checked. Note that interpretation of the curves for “Exported” and “Unadjusted” for an aggregated series will be affected by the “Fractions” settings in the selected extract selection. For “elspot” for which the setting is “Saved”, “Exported” corresponds to the forecast actually exported, while the curve for “elspot – true fractions” is created by reaggregating the forecasts with updated fractions.