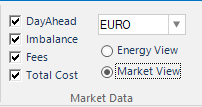
In Follow Up tab, the Market Data controls are used in the ribbon to toggle between Energy view and Market View. Make sure the Market Data controls are not hidden for your user in User settings in the File-tab.
After running any evaluation in Follow Up, view the Market Data for the series by clicking the radio button for Market View. Set what graphs to show diagrams by the checkboxes.
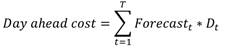
DayAhead – Shows spotprice cost calculation for the series. That is the forecast deviation, made before noon the day before.
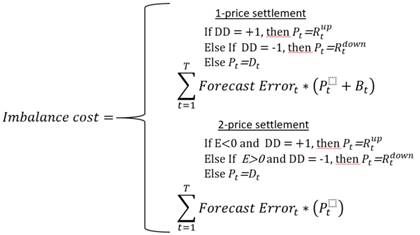
Imbalance – Shows Imbalance costs calculated as 1-price settlement or 2-price settlement
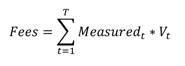
Fees – Volume fee is shown using this check box, the imbalance fee is included in the imbalance cost calculation
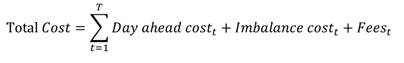
Total cost – Final calculation of costs including spotprice, regulation price and fees
|
Entity |
Type |
Comment |
|
Day ahead price, DA |
Variable Time series |
Imported locally at customer site from Market place or local import place |
|
Regulation fee, R (
|
Variable Time series. |
Imported locally at customer site from Market place or local import place. Displayed as Add on price from Day ahead price: ”Over/Under balance price” minus Day ahead price |
|
Balance power fee, B |
Fixed fee, changed occasionally |
Imported locally at customer site from local import place or manually entered in Config |
|
Volume fee, V |
Fixed fee, changed occasionally |
Imported locally at customer site from local import place or manually entered in Config |
|
Forecast, F |
Variable Time series. |
Forecast according to Extract, e.g. Day-ahead forecast |
|
Forecast error, E |
Variable Time series. |
Forecast according to Extract minus Measured time sereis, (e.g. Hour-ahead forecast) |
|
Measured value, M |
Variable Time series |
|
|
Dominating Direction, DD (U or +1 = System Up regulation D or -1 = System Down regulation - Or 0 = No system regulation) |
Variable Time series |
Imported from Market. Displays if system regulation has been mostly up or down. Especially important for time steps with both up and down regulation |