Incorrect historical values can be edited directly in the diagram curve or in the table grid.
To select hour values in the diagram curve, right-click in the diagram and select “Mark Data Points”.
You can edit several data points at the same time by selecting an area in the diagram. To select an area, hold down the left-hand button on the mouse and move the cursor over the area in question. Once an area has been selected, use the cursor to drag and drop the curve in the desired position. Find out more under “Getting started/User settings/Multi drag smoothing”.
Delete values by selecting an area and selecting “Delete” in the menu. The curves which are affected by this are controlled by the user settings (see “Getting started/User settings/Multi delete”).
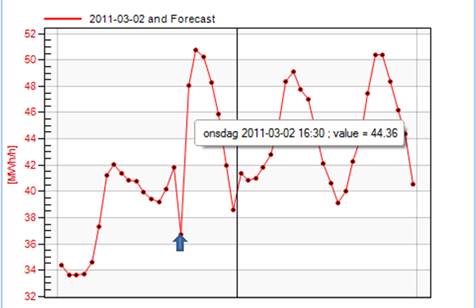
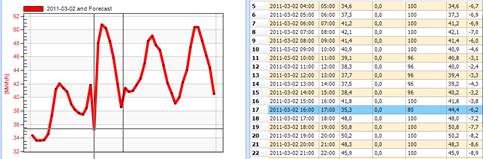
Editing can also be carried out directly in the data grid. By right-clicking in the diagram and selecting “Cursor”, a marker cross will appear and the selected diagram curve will be marked with a thicker line, while the selected hour value will be marked in the data grid so that you can easily see the link between a value in the diagram and the grid.
You can change the diagram curve by clicking up or down on the arrow keys on the keyboard, and left or right to move between hours in the diagram.
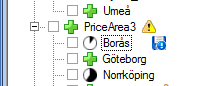
If you have changed a value but not yet saved it, a diskette symbol will be shown next to the load series you have edited.
You can then undo any changes by right-clicking on the load series in the file tree and choosing “Undo”.
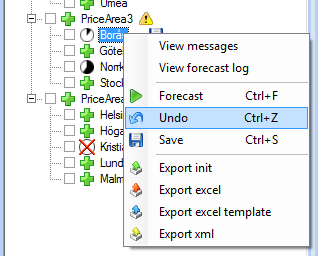
To save the changes, select “Save” instead and the diskette symbol next to the load series will disappear.