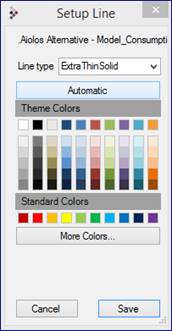
If you hover the cursor over the legend text for the series, the line will be highlighted in the diagram by being marked in bold. You can also select the colour and type of each curve in the diagram by clicking on the legend text in order to access the Setup Line dialog box.
This selection is saved under each user’s personal settings.
To open the settings for “Customization Dialog”, double-click in the diagram and then select “Style”. The window below is then displayed.
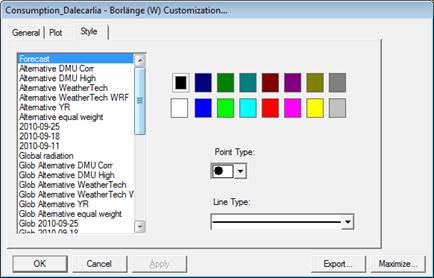
 to save
your changes. Note that your colour choices are connected only in the order in
which the curves are drawn in the diagram, and not to the name of the curve or
what it represents. Therefore, if we change the settings for “Forecast” and
“Alternative DMU Corr” above, we will have changed the settings for “Curve
number 1” and “Curve number 2” regardless of what this curve should represent in
future settings. In other words, different validations will share the same
colour selection.
to save
your changes. Note that your colour choices are connected only in the order in
which the curves are drawn in the diagram, and not to the name of the curve or
what it represents. Therefore, if we change the settings for “Forecast” and
“Alternative DMU Corr” above, we will have changed the settings for “Curve
number 1” and “Curve number 2” regardless of what this curve should represent in
future settings. In other words, different validations will share the same
colour selection.