 Figure 1: Empirical power curve
The Zephyros model is a hybrid model or ’gray-box’ model, i.e. a model which combines physical relationships with statistical methods. The estimation of the statistical parameters can be done regularly in order to adapt to recent data, either on request by the user or on a schedule. As input variables the following metrological parameters are used:
•Wind speed at 10, 80, (if available 100, 120) meters height
•Wind direction
•Temperature
•Sea level air pressure
These are listed above in order of their influence on the power output. The most important variables are the two wind speeds. These are used for estimating the present wind profile at the site, according to this wind profile, the forecasted wind speed at hub height is then calculated using interpolation. Varying wind speeds across the rotor area complicates the calculations, involving integrating the affecting power across the entire rotor area, however, for forecasting purposes a slightly simplified model is sufficient, where we assume the wind speed is held constant across the rotor area.
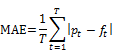
This interpolated wind speed is then adjusted by taking the air density into account. In modelling the impact on the density of temperature and pressure, the last two parameters listed are used. The historical adjusted wind speed is the predictor variable when training the model whereas the measured historical production is the response variable. In figure 1, the result from training a model is shown. Along the x-axis, observations of forecasted wind speed are plotted together with the observed production along the y-axis. The blue dots mark the mean production observed for each wind speed interval of 0.1 m/s length. For all available historical data, a curve is fitted using non-linear regression, also shown in figure 1, closely following the dots. This curve is the statistical or empirical counterpart of the theoretical power curves provided by wind turbine manufacturers. The other jagged curve show the number of observations which fall within each wind speed interval.
Figure 1: Empirical power curve
Why do the empirical and theoretical curves differ? Partly because the empirical curves are based on forecasted wind speed and not measured wind speed. These can be biased with respect to the true wind speed partly due to site-specific wind conditions and may be statistically depending on:
•Forecasted wind speed
•Forecasted wind direction
Typological variations and other turbine specific conditions such as wake effects can be taken into account by modeling each individual turbine within a farm. Otherwise, the model will estimate the combined effects when modeling the farm as one series.
The first type of deviations are minimized by the use of empirical power curves, whereas Zephyros tries to minimize the second type by separating all observations into wind interval sectors, fitting separate curves, one for each sector. Zephyros calculates automatically the optimal number of sectors used from 1 up to 12 by repeatedly applying statistical F-tests. Also, the theoretical power curves are only valid for a specific air density. As mentioned before, Zephyros adjusts the forecasts automatically with respect to air density differences.
In general, the training is designed to minimize future trading costs. Given these costs, a natural measure of the forecasting quality is the Mean Absolute Error (MAE), defined as
where T is the number of hourly observations
and 

Two notable aspects concerning wind power forecast are
•Skewed error distributions
•Constrained parameter space
Suppose we have plotted the historic production against the
historic predicted wind speeds. If we restrict ourselves by considering the
distribution for the production associated with predicted wind speeds below 3
m/s, this distribution will be skewed upwards, i.e. the major part will lie
close to zero with an upward ‘tail’ for occasions when the forecast
clearly has underestimated the wind speed.. Choosing an optimal forecast for
this wind speed interval depend on which so called cost function one wish to
minimize. We have already mentioned MAE, and another classical cost function
related to ordinary linear regression is the Root of Mean Squared Errors (RMSE).
Given the number of observations T with observed production
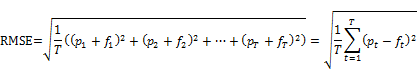
In our example, by definition, the RMSE is minimized if we choose the arithmetic mean of all measured production as the power forecast value for this wind speed interval (below 3 m/s). An alternative choice is the median, defined as the middle value when the production values are sorted by magnitude. By definition, the median minimizes, and in our example, the mean will be dragged upwards by the tail of the distribution and this increases the MAE. A model that aims at minimizing RMSE on the expense of MAE will therefore under long periods with calm weather overestimate the production in order to compensate for the relatively rare occasions when it underestimate the production instead. . In order to avoid these undesirable effects, Zephyros uses a so called trimmed regression where in each wind speed interval; the highest and lowest observations are removed before applying a classical non-linear regression. We then obtain a fitted regression curve approaching the median within each wind speed interval. Furthermore, the trimming makes the regression less sensitive to extreme values such as erroneous data. In figure 2, the trimmed result in red is compared to the non-trimmed curve in blue.

Figure 2: Medians red dots, means in blue.